Environmental Data
Material Balance
In FY2003, Iwatani began surveying the environmental impact of Iwatani and consolidated Iwatani Group companies in Japan. Based on the results of this survey, we summarize and publish data concerning our use of resources and waste discharge in our activities as the material balance. We will use these data to assess our environmental impact and advance efforts to create a sustainable society.
We will continue to make efforts to minimize our environmental impact and engage in highly transparent information disclosure.
*Total figures on this page are rounded down and may not match the sums of individual figures.
| Material balance*1*2 | FY2021 | FY2022 | FY2023 | FY2024 | |||
|---|---|---|---|---|---|---|---|
| Inputs | Electricity (MWh) | 344,793 | 336,325 | 335,171 | 347,393 | ||
| Steam (GJ) | 11,875 | 17,197 | 16,228 | 18,132 | |||
| Fuels (GJ) |
LPG | 153,305 | 140,036 | 129,118 | 125,638 | ||
| City gas/LNG | 54,235 | 58,809 | 53,229 | 49,991 | |||
| Diesel | 175,902 | 174,239 | 179,969 | 182,293 | |||
| Gasoline | 147,307 | 143,405 | 137,142 | 131,669 | |||
| Kerosene | 13,797 | 13,359 | 8,245 | 8,765 | |||
| Bunker A | 8,868 | 8,009 | 5,682 | 5,783 | |||
| Total water intake (thousand cu. m)*3 | ー | ー | 7,467 | 6,997 | |||
| Breakdown of water intake | Service water (thousand cu. m) | ー | ー | 195 | 201 | ||
| Groundwater (thousand cu. m) | ー | ー | 651 | 724 | |||
| Industrial water (thousand cu. m) | ー | ー | 425 | 423 | |||
| River water (thousand cu. m) | ー | ー | 58 | 58 | |||
| Sea water (thousand cu. m) | ー | ー | 6,136 | 5,591 | |||
| Other (thousand cu. m) | ー | ー | 0 | 0 | |||
| Outputs | GHG emissions (t) | Domestic Scope 1 and 2*1 | 236 | 227 | 228 | 234 | |
| Overseas Scope 1 and 2*4 | ー | 159 | 199 | 209 | |||
| Total wastewater (thousand cu. m)*3 | ー | ー | 6,927 | 6,529 | |||
| Breakdown of wastewater | Sewer (thousand cu. m) | ー | ー | 195 | 255 | ||
| River (thousand cu. m) | ー | ー | 252 | 300 | |||
| Sea (thousand cu. m) | ー | ー | 6,305 | 5,742 | |||
| Other (thousand cu. m) | ー | ー | 173 | 232 | |||
| Recycled water (thousand cu. m) | ー | ー | 274 | 273 | |||
| Total industrial waste discharge (t) | ー | ー | 26,500 | 21,382 | |||
| Industrial waste discharge (t) | 5,722 | 11,024 | 14,885 | 12,221 | |||
| Specially managed industrial waste discharge (t) | ー | ー | 2,351 | 79 | |||
| Valuable waste sold (t) | ー | ー | 9,264 | 9,082 | |||
| Hazardous waste discharge (t) | ー | ー | 3 | 0 | |||
| Recycled waste (t) | ー | ー | 1,187 | 1,067 | |||
| Mandatory recycling volume for containers and packaging (kg) | ー | ー | ー | 290,216 | |||
| Glass bottles (kg) | ー | ー | ー | 1,200 | |||
| PET bottles (kg) | ー | ー | ー | 3,020 | |||
| Paper containers and packaging (kg) | ー | ー | ー | 315 | |||
| Plastic containers and packaging (kg) | ー | ー | ー | 285,681 | |||
| Sulfur oxide (SOx) emissions (t) | ー | ー | 1 | 0 | |||
| Nitrogen oxide (NOx) emissions (t) | ー | ー | 7 | 7 | |||
| Soot emissions (t) | ー | ー | 82 | 78 | |||
| Volatile organic compound (VOC) emissions (t) | ー | ー | 19 | 10 | |||
| Chemical oxygen demand (COD) emissions (t) | ー | ー | 0 | 0 | |||
| Substances subject to PRTR reporting (t) | Emissions | ー | ー | 12 | 14 | ||
| Transported | ー | ー | 18 | 11 | |||
Greenhouse gases (GHG)
(Kt-CO2e)
| GHG emissions | FY2021 | FY2022 | FY2023 | FY2024 | Remarks | ||
|---|---|---|---|---|---|---|---|
| Scope 1 (direct emissions) | Japan*1 | 85 | 86 | 83 | 84 | ||
| Overseas*4 | ー | 38 | 33 | 35 | |||
| Total | ー | 124 | 116 | 119 | |||
| Scope 2 (indirect emissions) | Japan*1 | 151 | 142 | 145 | 149 | ||
| Overseas*4 | ー | 121 | 165 | 174 | |||
| Total | ー | 263 | 310 | 323 | |||
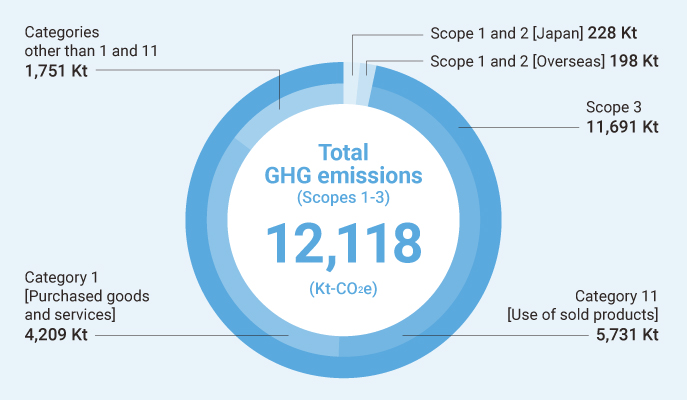
| Scope 1 and 2 | Total of Japan and overseas | ー | 387 | 427 | 443 | ||
| Scope 3*5 | Total of all categories | 8,846 | 10,764 | 11,691 | 11,667 | ||
| 1 | Purchased goods and services | 3,181 | 4,233 | 4,209 | 4,307 | ||
| 2 | Capital goods | 25 | 71 | 64 | 48 | ||
| 3 | Fuel- and energy-related activities not included in Scope 1 or Scope 2 | ー | 44 | 50 | 52 | ||
| 4 | Upstream transportation and distribution | ー | 57 | 56 | 52 | Calculated using the calculation scope and method for specific shippers in the calculation, reporting, and disclosure system | |
| 5 | Waste generated in operations | 15 | 30 | 40 | 36 | ||
| 6 | Business travel | 1 | 1 | 1 | 1 | ||
| 7 | Employee commuting | 4 | 5 | 5 | 5 | ||
| 8 | Upstream leased assets | ー | ー | ー | ー | Emissions associated with the use of leased assets are omitted, as they are calculated in Scope 1 and Scope 2 | |
| 9 | Downstream transportation and distribution | ー | ー | ー | ー | Omitted due to the diverse nature of transportation and distribution, which renders accurate assessments difficult | |
| 10 | Processing of sold products | ー | ー | ー | ー | Omitted due to the diverse range of products, which renders accurate assessments difficult | |
| 11 | Use of sold products | 5,492 | 6,197 | 5,731 | 5,640 | Emissions resulting from the use of LP gas, LNG, kerosene, and carbon dioxide gas sold | |
| 12 | End-of-life treatment of sold products | ー | ー | ー | ー | Omitted due to the diverse range of products, which renders accurate assessments difficult | |
| 13 | Downstream leased assets | 0.4 | 0.3 | 0.3 | 0.3 | ||
| 14 | Franchises | ー | ー | ー | ー | Omitted due to no relevance | |
| 15 | Investments | 125 | 124 | 1,531 | 1,523 | ||
| Solar power consumed in-house (MWh)*6 | ー | ー | 5,001 | 4,942 | |||
| Green power purchased (MWh) | ー | ー | 12,418 | 12,455 | |||
GHG Reduction Target
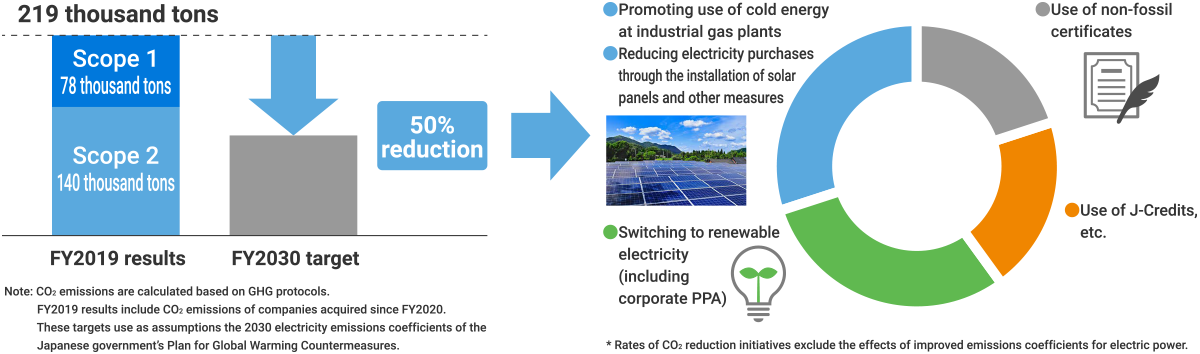
The Iwatani Group has announced its goal of achieving carbon neutrality by FY2050, targeting as a milestone to be reached by FY2030 reductions of 50% in CO2 emissions compared to FY2019 levels by the Iwatani Group in Japan.*1
FY2024 GHG emissions (Scopes 1-3)
- *1 Totaled for Iwatani Corporation business sites in Japan, Japanese consolidated subsidiaries, and two equity-method affiliates with high energy use
- *2 Items shown have been changed since FY2023 in accordance with Environmental Reporting Guidelines 2018.
- *3 In some cases, estimates of water intake and wastewater are based on employee numbers or floor area weighted by rate of use.
- *4 Overseas Scopes 1 and 2 figures are totaled for Iwatani Corporation’s overseas business sites and overseas consolidated subsidiaries.
- *5 Calculations exclude the following categories:
Category 8 (included in Scopes 1 and 2 calculations), categories 9, 10, and 12 (difficult to ascertain due to wide-ranging subjects), and category 14 (no subject activities). - *6 Solar power includes PPAs.
- Note : Underscored figures have been independently verified by SOCOTEC Certification Japan.
- Please refer to the third-party assurance reports available below.
- FY2024 (Scope 1, Scope 2, Scope 3)
- FY2023 (Scope 1, Scope 2, Scope 3)
- FY2022 (Scope 1, Scope 2, Scope 3)
- FY2019-FY2021 (Scope 3)
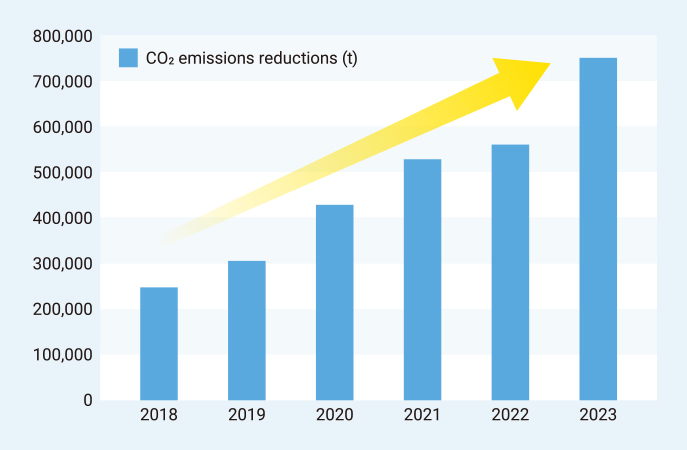
Contributions to CO2 reductions
Through fuel conversion to LPG and LNG, supplying hydrogen for fuel cell vehicles and fuel cell buses, and expanding sales of biomass fuel (PKS), biomass PET resin, Hydrogen-based premixed cutting gas (Hydrocut®), and biomass PP resin, we contributed to a CO2 emissions reduction of approximately 780,000 tons in FY2024. We will continue contributing to global warming prevention through proactive efforts to develop and expand sales of clean energy and other solutions
| Product, service |
Reduction concept |
|---|---|
| LPG and LNG fuel conversion | Contributing to CO2 emissions reductions (at the stage of use) through conversion from heavy oil and other fuels to LPG and LNG |
| Supplying hydrogen for FCVs and FC buses | Contributing to CO2 emissions reductions (at the stage of use) by supplying hydrogen as fuel for FCVs and FC buses |
| Biomass fuel (PKS) | Contributing to CO2 emissions reductions (at the stage of use) by supplying PKS for power generation use |
| Biomass PET resins | Contributing to CO2 emissions reductions through replacing traditional PET resins with resins made from plant-derived raw materials (at the stages of raw-material production and waste disposal) |
| Hydrocut® premixed hydrogen-cutting gas | Contributing to CO2 emissions reductions (LCA) via the replacement of acetylene and other cutting gases with hydrogen-mixed Hydrocut® gas |
| Bio-PP resins | Contributing to CO2 emissions reductions during production, disposal, and incineration (at the stages of raw material production and waste disposal) by replacing traditional PP resins with resins made from plant-derived raw materials |